- Home
- About Us
- GAINS
- News/TAG Webinars
- Membership
- Annual Meeting/SAGEEP
- SAGEEP 2026
- SAGEEP 2025
- SAGEEP 2025-Munitions Response Meeting Abstracts/Sessions
- SAGEEP 2025-MRM Exhibiting/Sponsorship Opportunities
- SAGEEP 2025-MRM Accommodations
- SAGEEP 2025-MRM Registration Information
- SAGEEP 2025-MRM Program
- SAGEEP 2025-Munitions Response Meeting Short Courses
- SAGEEP 2025/MRM Luncheons/Conference Events/Activities
- SAGEEP 2024
- SAGEEP 2023
- SAGEEP 2022
- SAGEEP 2021
- SAGEEP 2020 Exhibiting/Sponsorship
- SAGEEP-2019
- SAGEEP 2019 Exhibiting/Sponsorship
- SAGEEP 2018
- SAGEEP 2017
- SAGEEP 2016
- SAGEEP 2015
- Proceedings SAGEEP 2024
- Proceedings SAGEEP 2023
- Proceedings SAGEEP 2022
- Proceedings SAGEEP 2018
- Proceedings SAGEEP 2025
- Publications & Merchandise
|
|
|
Engineering log enhancements Automated depth matcher |
Unit converter |
Join us for this informative short course and workshop! We promise a few surprises as well!
SC-7: "Satellite InSAR Data: Reservoir Monitoring from Space"
Course Provider: EAGE
Instructor: Alessandro Ferretti
Time: 8:30 a.m. - 4:30 p.m.
Course Description:
Satellite radar data for surface deformation monitoring is gaining increasing attention, and not only within the oil and gas community. It provides a powerful tool for remotely measuring extremely small surface displacements over large areas and long periods of time, without requiring the installation of in-situ equipment. However, apart from remote sensing and radar specialists, only a relatively small number of geoscientists and engineers understand how a radar sensor orbiting the Earth at about 7 km/s from 700km above the Earth's surface can actually measure ground displacements of a fraction of a centimeter.
This course provides a step-by-step introduction to satellite radar sensors, SAR imagery, SAR interferometry and advanced InSAR techniques. Rather than a tutorial for remote sensing specialists, the course starts from very basic concepts and explains in plain language the most important ideas related to SAR data processing and why geoscientists and engineers should take a vested interest in this new information source. Instead of providing a thorough analysis of InSAR algorithms, the main aim of the course is to diffuse the news about the potential impact of InSAR results on many real-life applications, highlighting where and when they can provide effective solutions. Participants will learn that InSAR is not only an information source for research and development activities, but also a reliable tool that can be applied successfully to many different applications, spanning from sinkhole detection to reservoir optimization. Special attention will be paid to oil and gas applications where surface deformation data can provide valuable constraints on reservoir dynamics, enabling time-lapse monitoring of volumetric strains at depth. Volume changes in the reservoir induced by fluid extraction and injection can induce both subsidence and uplift. Stress changes may then trigger the reactivation of faults and threaten well integrity. Depending on the depth of the reservoir and the characteristics of the cap rock, deformation may also be detectable at the surface. After demonstrating case studies focussing on secondary and tertiary oil recovery, Carbon Capture and Sequestration (CCS) and Underground Gas Storage (UGS), allowing participants to understand the strengths and limitations of satellite radar data and compare InSAR with other in situ observations, the course will describe the available historical archives of SAR images, allowing, even if not at full worldwide coverage, the estimation of surface deformation phenomena since 1992.
The course will conclude with a brief discussion of the new satellite sensors to be launched in the next few years and the new trends in data integration and visualization.
Thursday March 29, 2018
SC-4: From AEM data to 3D hydrogeological conceptual model
Instructors: Tom Martlev Pallesen, MSc, Chief Geologist, and Mats Lundh Gulbrandsen, Ph.D., R&D Consultant Geophysicist, I*GIS A/S
Time: 8:30 a.m. - 4:30 p.m.
Course Description:
Groundwater mapping and hydrogeological conceptual modelling, using AEM data is a “hot topic”. The GeoScene3D Team at IGIS is a part of the Danish suite of technical solution providers in this area, and has a deep expertise and experience.
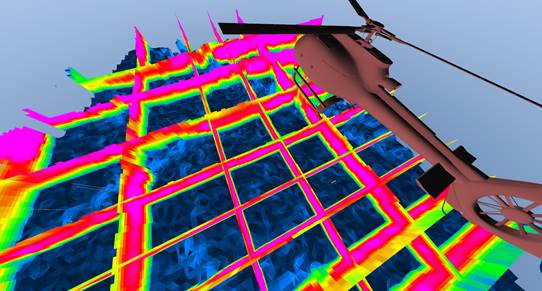 In this course we will dive into the process of building a 3D conceptual model from scratch using AEM and other data types. This “hands-on” course goes through the practicalities in modelling using the GeoScene3D software. We will dive into how you get the most of your AEM data. We will look into traditional manual modelling techniques as well as Machine Learning tools for inspecting AEM data and doing the modelling. This includes the GeoScene3D clustering tools for AEM data, used to locate features in data not directly observable by the eye, and machine assisted modelling tools using Smart Interpretation. The course will be a combination of short lectures and exercises, and at the end of the day you will have gone through the full process of creating a new project, loading all your data, inspecting and visualizing data in 3D, on cross-sections and in GIS maps and, and with you fellow course participant you will build an actual 3D conceptual model as an end result.
The GeoScene3D Team will provide course participants with a 3 month full license for GeoScene3D. The participants are required to bring their own laptops with a reasonable graphics card, see more on https://www.geoscene3d.com.
CANCELLED SC-5: Understanding “Why” and “How” to use TDEM Methods for Near-surface ApplicationsInstructor: Rob Harris, Geonics Limited
Time: 8:30 a.m. - 4:30 p.m.
Course Description:
With an emphasis on practical considerations, this course will provide a basic introduction to the time domain electromagnetic (TDEM) method. Several near-surface applications will be discussed including the detection of water infiltration in levees and the mapping of voids and sinkholes and depth-to-bedrock. Examples demonstrating the use of Geonics’ G-TEM time domain system in a novel “moving” configuration will be included. The G-TEM system can add much information to the picture of the earth below five metres, filling in the space between a Ground Conductivity Meter survey and large-loop TDEM soundings; this small-scale, dynamic system, moving quickly from point to point, measures both vertical changes in conductivity and lateral changes in horizontal layers to depths of 20 – 40 metres.
SC-6: Land and Marine Resistivity/IP Imaging in 2D, 3D and 4D
Time: 8:30 a.m. - 4:30 p.m.
Instructor: Jason Greenwood, AGI
Course Description:
This course will provide attendees with a better understanding of 1D, 2D, 3D and 4D resistivity/IP imaging methods in various land and marine settings. Topics will focus on processing case history data sets with EarthImager(tm) software (1D, 2D, 3D & 4D), data filtering, forward and inverse modeling, 2D and 3D array design and hands-on practice on how to process surface data, borehole data, terrain (topography) information, underwater data, continuous resistivity profiling (CRP) data on land and marine, 3D data and (4D) time-lapse monitoring data.
This course is open to all levels of experience. Attendees who have already worked with resistivity/IP methods will have a chance to focus on particular case examples from their work, difficult to process data or more advanced methods like time lapse inversion, 3D surveys around a foundation and other less often applied methods. We will have all of these data types to work with in the class and can fit the materials for each attendees needs. We will have a short outdoor demonstration with the AGI SuperSting resistivity/IP/SP system as well. This class requires each attendee to bring a Windows laptop and to have administrative privileges so that EarthImager may be installed (Windows 7, 8 or 10).

